SAN ANTONIO (September 6, 2023) – The Texas lodging industry saw modest demand and revenue gains in the Second Quarter of 2023 as the sector enters a “normalization” period after precipitous losses during the pandemic and momentous gains during the recovery phase. Statewide revenues hit nearly $4.17 billion in the Second Quarter of 2023. This quarter’s revenue was only 4.4% higher than Q2 2022, but this still makes this the highest lodging revenue quarter on record. Analysis by Source Strategies, the Texas hotel data collection and crunching leader, shows the hospitality market in Texas settling back to a more normal growth pattern after 2020’s pandemic-related demand losses. Source Strategies’ quarterly Hotel Brand Report summarizes the state of the Texas lodging industry as it sets new performance highs, and their Texas Hotel Performance Factbook lists every individual hotel’s performance in the latest quarter.
Demand, as measured by room-nights sold, in the state’s five largest metros continues to surpass pre-pandemic levels, but some metros experienced some demand backslide after 2022’s record rebound. Houston-Baytown-Sugar Land (up 5.7%), Fort Worth-Arlington (up 2.2%) and Dallas (up 1.4%) saw positive demand changes compared to Q2 2022. Austin-Round Rock (down 5%) and San Antonio (down 2.2%) experienced some reduction in demand as the industry reverts to more normal levels. Statewide demand was up 1.2% in Second Quarter 2023 compared to Q2 2022, but up 11.9% when compared to pre-pandemic Q2 2019.
“After the volatile conditions in the industry in 2020 and 2021, returning to a more normal growth rate is welcome,” says Todd Walker, Source Strategies president. “Strong demand increases in the Texas energy sector as well as the continuing recovery of the Dallas and Houston Metros has been a welcome sign for the Texas lodging industry.”
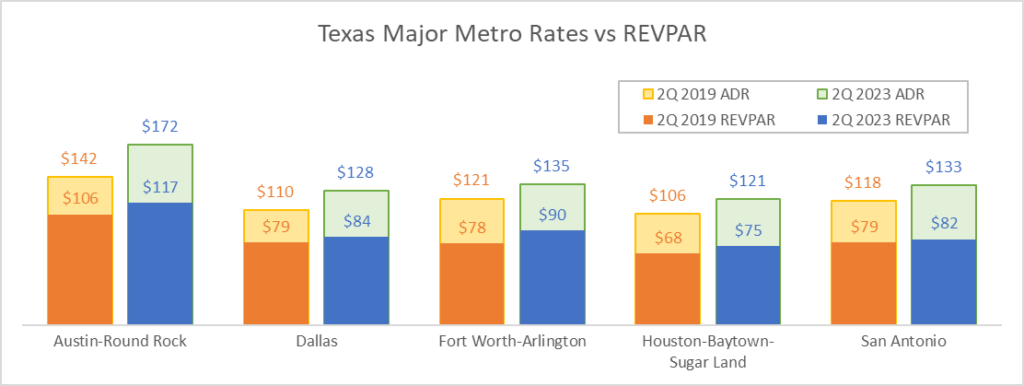
The chart below compares Average Daily Rates (ADR) to the Revenue per Available Room (REVPAR). A widening differential between ADR and REVPAR indicates that many hotels continue to emphasize keeping rates higher as occupancy slowly recovers through 2023 and 2024.
Demand in Texas’ Oil & Gas areas continues to rise at a faster rate than the balance of the state. Texas’ energy sector counties have now enjoyed ten consecutive quarters of positive demand growth. Odessa led energy sector market demand increases with room-nights sold (RNS) up 22.6% versus Q2 2022 (17.4% over Q2 2019), followed by Midland (up 17.1% and a huge 68.6% over Q2 2019). Houston-Baytown-Sugar Land rounded out the top three with demand up 5.7% (up 19.2% vs Q2 2019). McAllen-Edinburg-Pharr noted the largest demand drop in the sector, with RNS down 6.8% vs Q2 2022.
Notables:
- Second Quarter REVPAR (Revenue Per Available Room) statewide was $78.55, three dollars (4.5%) higher than the Second Quarter of 2022 and $6 (8.3%) above Q2 2019. REVPAR in Austin-Round Rock was $117.05 to lead all major metros, but this figure was down 6.5% from Q2 2022. Fort Worth-Arlington followed at $90.30 (up 6.7%) and Dallas at $84.13 (up 3.8%). The Houston Metro’s REVPAR for the quarter of $75.16 was more than ten dollars (15.9%) higher than a year ago.
- Texas average occupancy was 63.5% for the quarter, 3.2 points below Second Quarter 2019. The El Paso metro reclaimed the top spot in Second Quarter of 2022 with average occupancy of 69.1%, followed by Abilene (68%), Austin-Round Rock (67.9%), Waco (67.6%) and Fort Worth-Arlington (67%). The Houston and San Antonio metros were both below the state average occupancy. Victoria clocked in with the lowest occupancy in the state at 53.4%.
- Non-metro area revenues rose 4.9% compared to Q2 2022 and accounted for 8.2% of total Texas revenues. Occupancies in these areas hit 60.3% as REVPAR was $58.76.
- The Top 10 REVPAR Performers of Second Quarter 2023 were, in order: Miraval Austin Resort & Spa, Austin; Post Oak Hotel, Houston; Rosewood Mansion at Turtle Creek, Dallas; Commodore Perry Estate, Austin; Austin Proper Hotel & Residences, Austin; Four Seasons Austin, Austin; Hotel Emma, San Antonio; Rough Creek Lodge, Iredell; Hotel Crescent Court, Dallas; Hotel Drover, Fort Worth.
- The city of Austin continues its strong showing with 33 hotels in the top 100 REVPAR slots in our list this quarter! Dallas had 16, Houston had 8, while Fort Worth and San Antonio each had 7.
| Second Quarter 2023 | Revenues (000s) | Second Quarter Metrics | Changes vs 2019 | |||||||
| Metropolitan Areas | % Market | Q2 2022 | Q2 2023 | Change vs Q2 2022 | Q2 2023 % Occ | Q22023 $ ADR | Q2 2023 REVPAR | Occ Change vs Q2 2019 | ADR Change vs Q2 2019 | REVPAR Change vs Q2 2019 |
| Dallas | 19.0% | $746,616 | $790,286 | 5.8% | 65.5% | $128.45 | $84.13 | -8.4% | 16.8% | 7.0% |
| Fort Worth-Arlington | 9.0% | $348,722 | $376,704 | 8.0% | 67.0% | $134.78 | $90.30 | 3.2% | 11.6% | 15.2% |
| Houston Metro | 20.0% | $742,327 | $833,712 | 12.3% | 62.3% | $120.64 | $75.16 | -3.0% | 13.4% | 10.0% |
| Austin-Round Rock | 14.8% | $653,372 | $617,603 | -5.5% | 67.9% | $172.38 | $117.05 | -9.1% | 21.6% | 10.5% |
| San Antonio | 10.3% | $432,126 | $429,574 | -0.6% | 61.5% | $133.29 | $81.97 | -7.7% | 12.6% | 3.9% |
| Non-Metro Areas | 8.2% | $326,935 | $343,037 | 4.9% | 60.3% | $97.45 | $58.76 | -3.2% | 10.3% | 6.8% |
| Corpus Christi | 3.2% | $128,617 | $131,820 | 2.5% | 60.1% | $122.46 | $73.60 | -7.3% | 11.5% | 3.4% |
| El Paso | 2.0% | $72,013 | $83,105 | 15.4% | 69.1% | $107.22 | $74.09 | -6.6% | 30.6% | 21.9% |
| Midland & Odessa | 1.9% | $62,725 | $78,981 | 25.9% | 63.5% | $94.70 | $60.08 | -8.4% | -29.9% | -35.9% |
| Balance of Texas | 11.6% | $480,750 | $484,177 | 0.7% | 62.1% | $96.59 | $60.00 | -1.1% | 14.5% | 13.2% |
| Total State of Texas | 100% | $3,994,202 | $4,169,000 | 4.4% | 63.5% | $123.61 | $78.49 | -4.8% | 13.7% | 8.3% |
For more information, contact:
- Source Strategies Senior Vice President Paul Vaughn, (210) 734-3434, [email protected]